Chapter 4 Functional Analysis of TargetDatabase
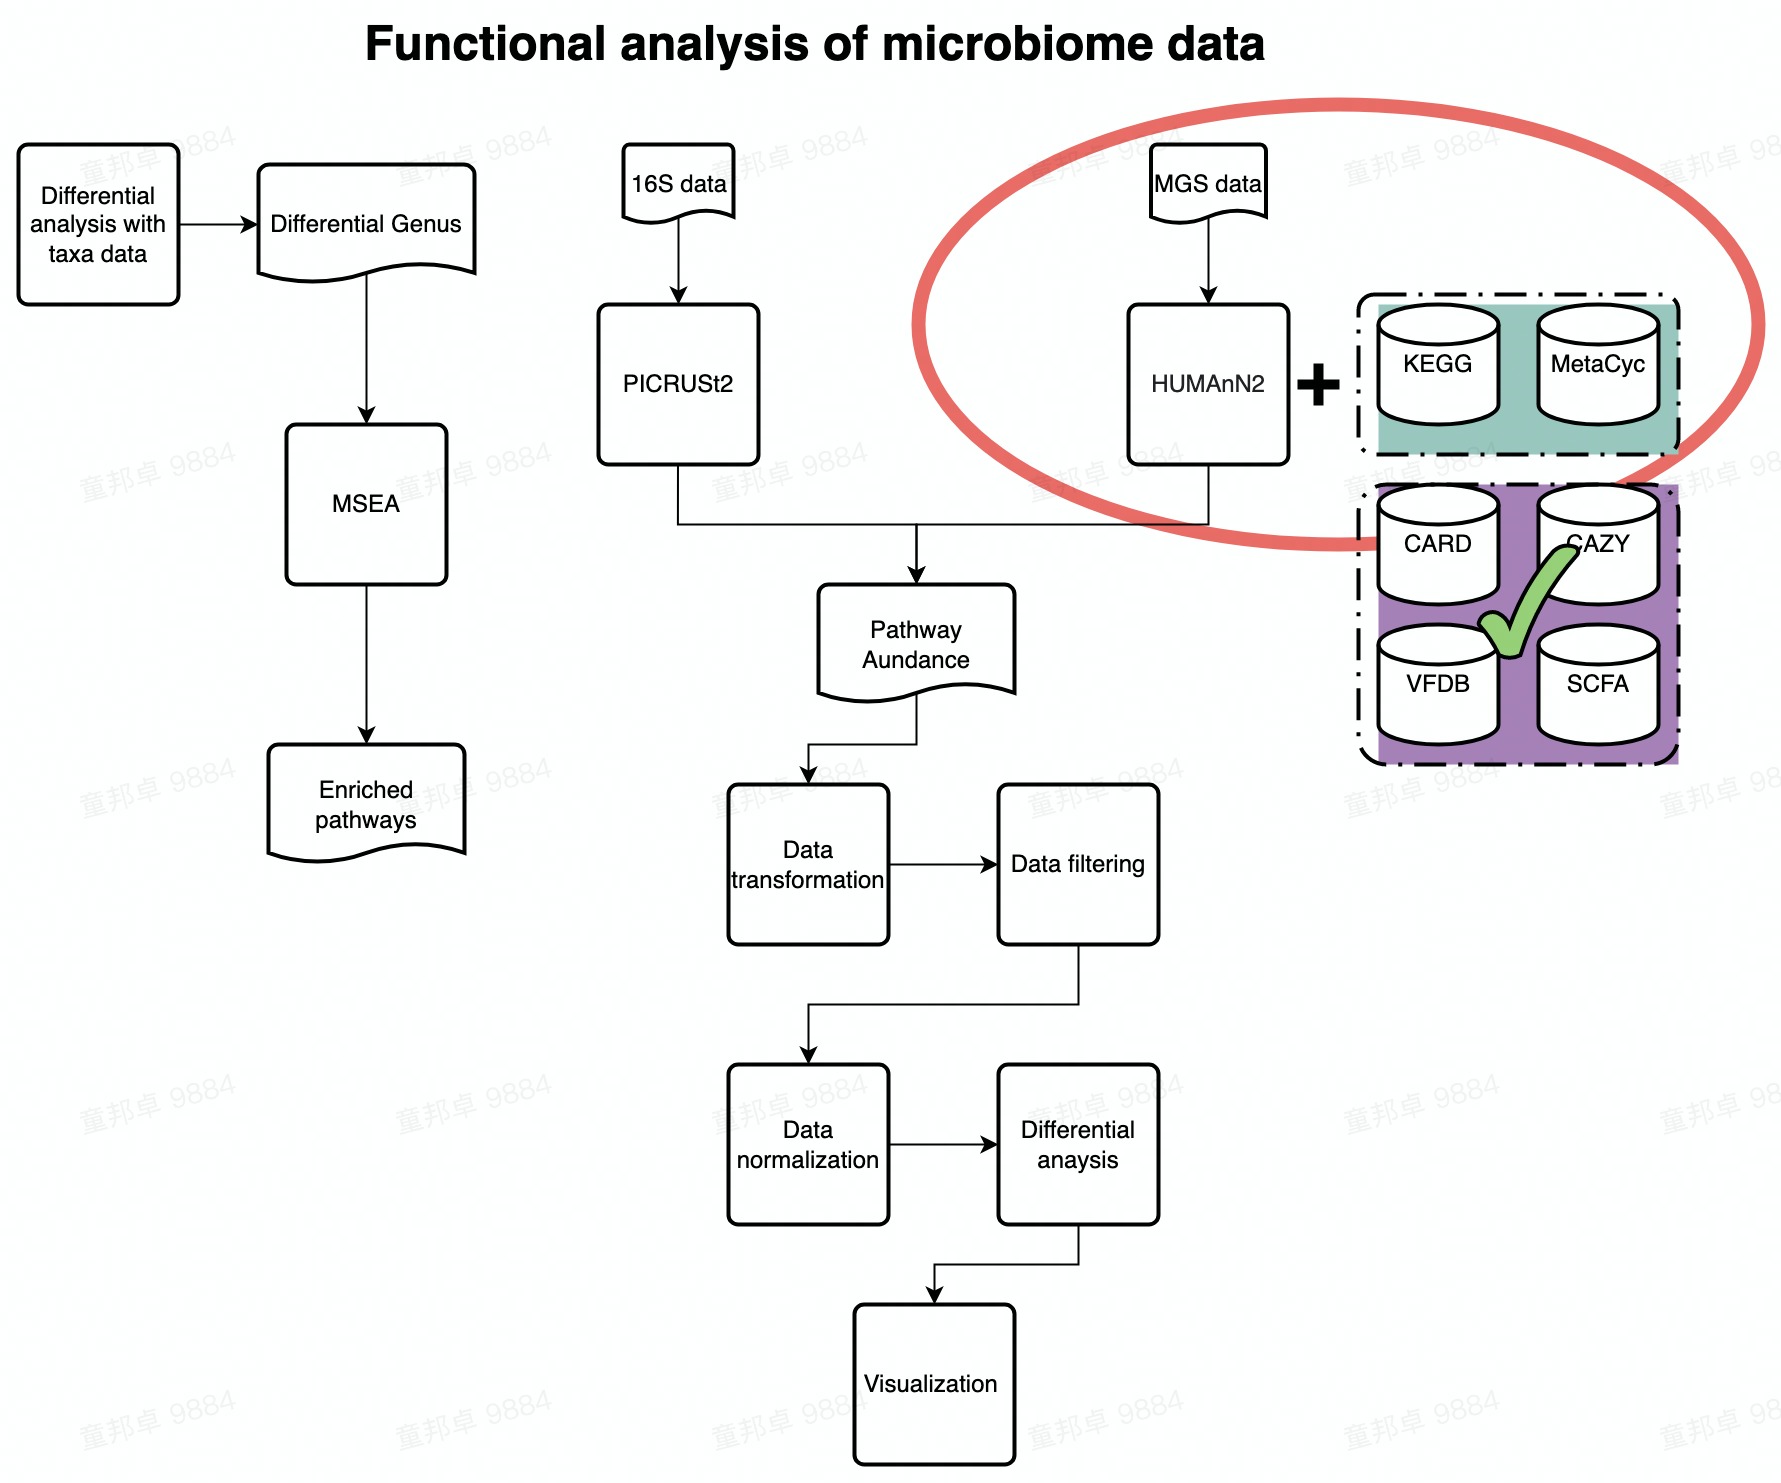
This demo guides you how to analyze the pathway profile annotated from humman2 against 7 target databases.
Target database inclues 7 types:
acetate
butyrate
formate
propionate
card
cazy
vfdb

FlowChart_KEGG
The analysis of the 7 types of target databases are pretty much the same, here we use CARD database as an example.
4.1 Environment setup
4.2 Pipeline file processing
As described in the introduction chapter, a cohort containing 8 MGS samples of 4 patients from 2 groups in MAFLD project would be used as demo data in this tutorial.
4.2.1 Merge sample files (Target db)
Here we need to merge all CARD data from 8 samples into one profile table with the merge script from Humann2 in Bash. But if you have merged the sample data already, please skip this chunk and jump to Data loading.
4.2.2 Split strain info (Target db)
Output profile from Humann2 pipeline contains strain information, we need to split the profile file into two files in Bash. But if you have splitted the sample data already, please skip this chunk and jump to Data loading.
- unstratified profile file
- stratified profile file
grep -v "s_" /share/projects/SOP/Functional_Analysis/Tongbangzhuo/Demodata/Card/merged_card_profile.tsv >  /share/projects/SOP/Functional_Analysis/Tongbangzhuo/Demodata/Card/merged_card_profile_unstratified.tsv

grep -E "s_|ID" /share/projects/SOP/Functional_Analysis/Tongbangzhuo/Demodata/Metacyc/merged_metacyc_profile.tsv >  /share/projects/SOP/Functional_Analysis/Tongbangzhuo/Demodata/Card/merged_card_profile_stratified.tsv
4.3 Data loading (Target db)
Since the format of pathway profile annotated in 7 target databases are almost identical, We use card data as an example.
Same as kegg pathway data, we rescale data at the begining of analysis to reduce the differences of sequencing depth across all samples.
Read in card data
## Read in merged card profile data

merged_card_profile <- read.table('/share/projects/SOP/Functional_Analysis/Tongbangzhuo/Demodata/Card/merged_card_profile_unstratified.tsv',
                                  sep = '\t', header = TRUE, check.names = FALSE, na.strings = '',comment.char = '', quote = '')

colnames(merged_card_profile) %<>% str_remove_all(., '_.+')

# ## Rename entry name, keep ARO number
# merged_card_profile$ID %<>% str_replace_all(., '.+(ARO:[0-9]+)\\|(.+)_\\[.+\\]', '\\1|\\2')
#
# head(merged_card_profile, n = 2)

## Read in metadata (Group information)
metadata <- read.table('/share/projects/SOP/Functional_Analysis/Tongbangzhuo/Demodata/metadata.xls', check.names = FALSE, header = TRUE)

metadata %<>% column_to_rownames('SeqID')
4.4 Data preprocessing (Target db)
4.4.1 Transforming data (Target db)
rescaled_merged_card_profile <- merged_card_profile %>% column_to_rownames('ID') %>% apply(., 2, function(x) x/sum(x)) %>% as.data.frame()

head(rescaled_merged_card_profile, n = 2)
## 16453 16455 16456 16457 16461 16464 16465 16466
## UNMAPPED 9.988510e-01 9.984107e-01 9.991099e-01 9.994578e-01 9.989571e-01 0.9993301 9.992888e-01 9.990494e-01
## gb|AAA20116.1|ARO:3000180|tetA(P)_[Clostridium_perfringens] 2.266749e-06 1.249741e-06 9.247141e-07 1.215390e-07 4.040324e-07 0.0000000 6.341580e-08 3.858159e-06## [1] 908 84.4.2 Remove unppaed pathways (Target db)
## In this chunk, we remove the umapped row in rescaled profile table because we are not able to intepret UNMAPPED entry.

card_profile <- rescaled_merged_card_profile[grep("UNMAPPED", rownames(rescaled_merged_card_profile), invert = TRUE), ]

dim(card_profile)
## [1] 907 84.4.3 Aggregate low abundance data
In this chunck, we aggregate low abundance features to one row.
1e-12 is an empirical threshold fot filtering low abundance feature. According to published paper Obese Individuals with and without Type 2 Diabetes Show Different Gut Microbial Functional Capacity and Composition, pathway with top 50% mean abundance and top 50% variance are left. But in MaAsLin2,pathway with abundance less than 10-10 are filtered by default.
Note: Run Transforming data and Remove unmapped pathways before running this chunk!
Filtered_card_profile <- aggregate_low_abundance(input_data = card_profile,
                                                           threshold = 1e-12) ## threshold should be modified based on your on study

dim(Filtered_card_profile)
## [1] 907 84.5 Standard analysis
Note: All chunks in Data preprocessing should be excuted before doing analysis in this chunk.
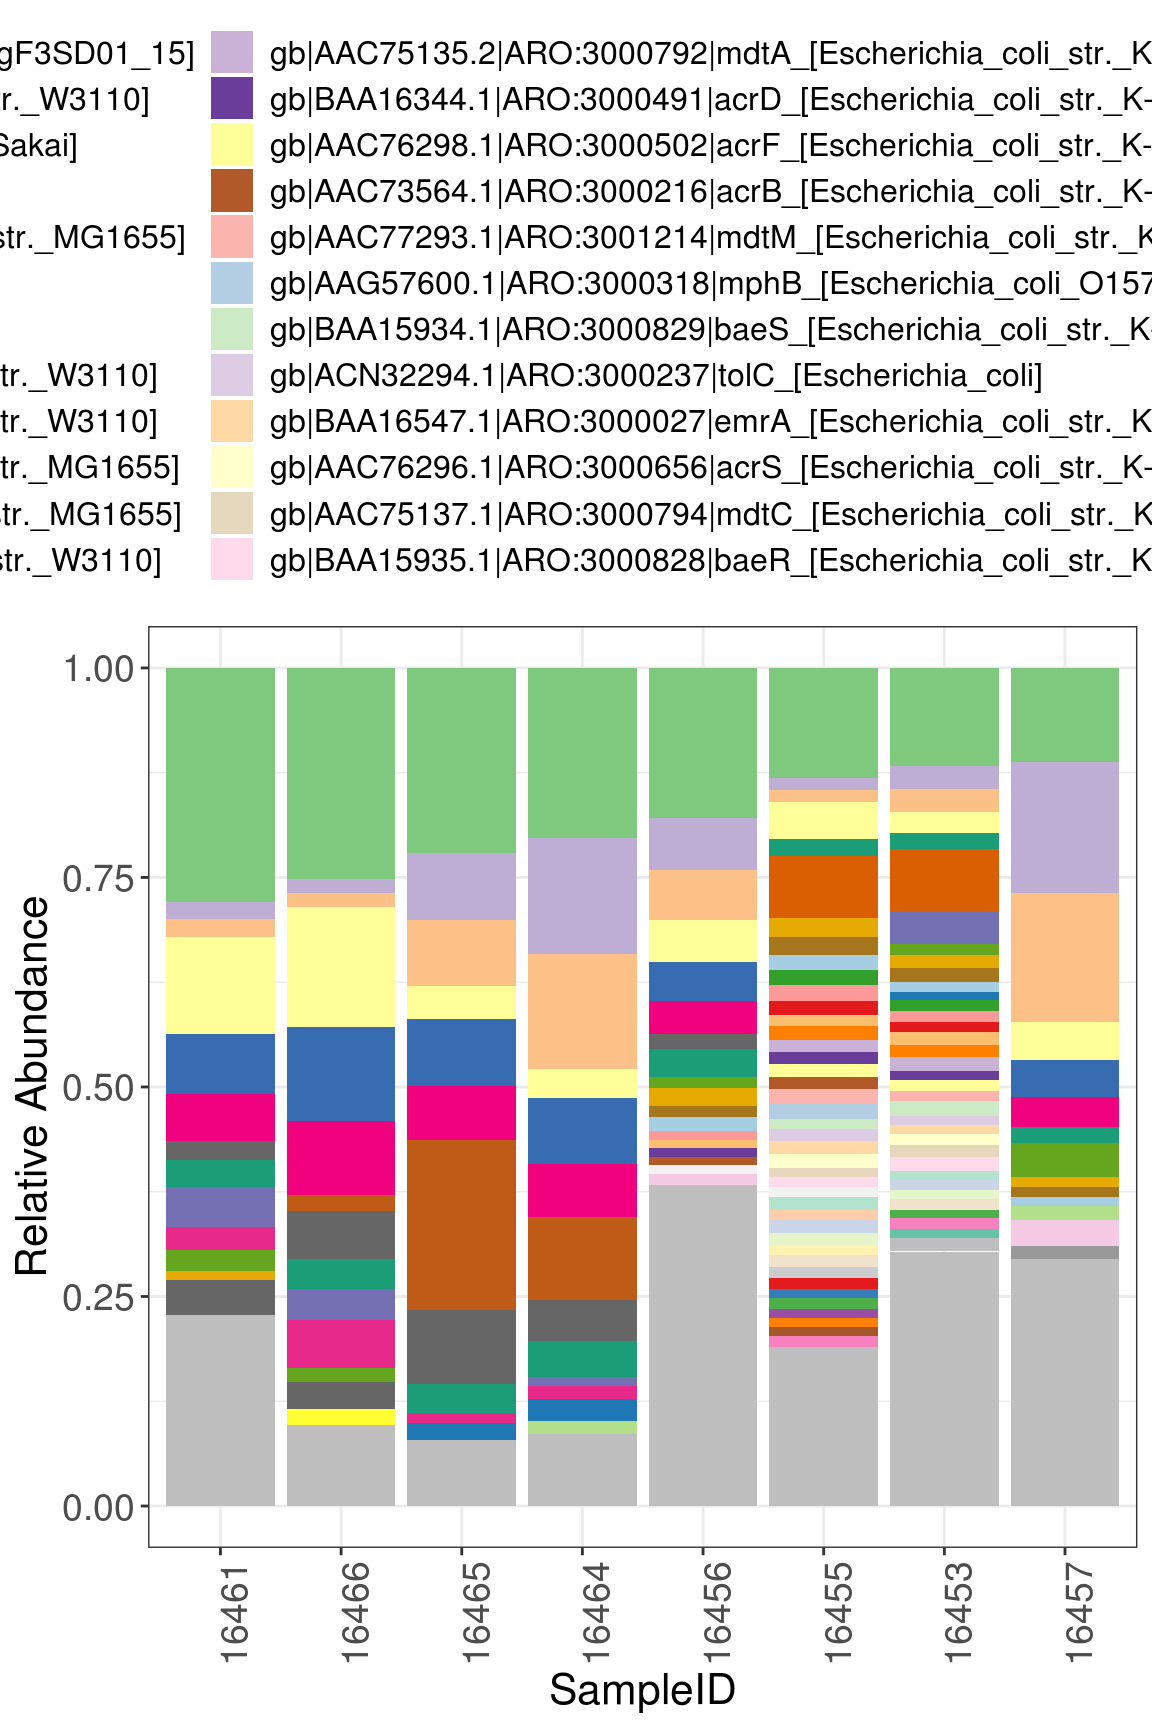
4.5.1 Compositional barplot
## In this chunk, we construct stacked pathway barplot to depict the pathway composition of samples, we use function plot_stacked_bar from xviz to plot.
## In case there are too much entries, we use parameter "collapse" in plot_stacked_bar function to integrate entries whose abundance are below given threshold into "Others".
## Note: Adjust your graph size to show complete graph.

compositional_plt <- xviz::plot_stacked_bar(otu_table = Filtered_card_profile %>% t() %>% as.data.frame(),
                 metadata = metadata, collapse = 0.01) + theme(axis.text.x = element_text(vjust = 1))

compositional_plt
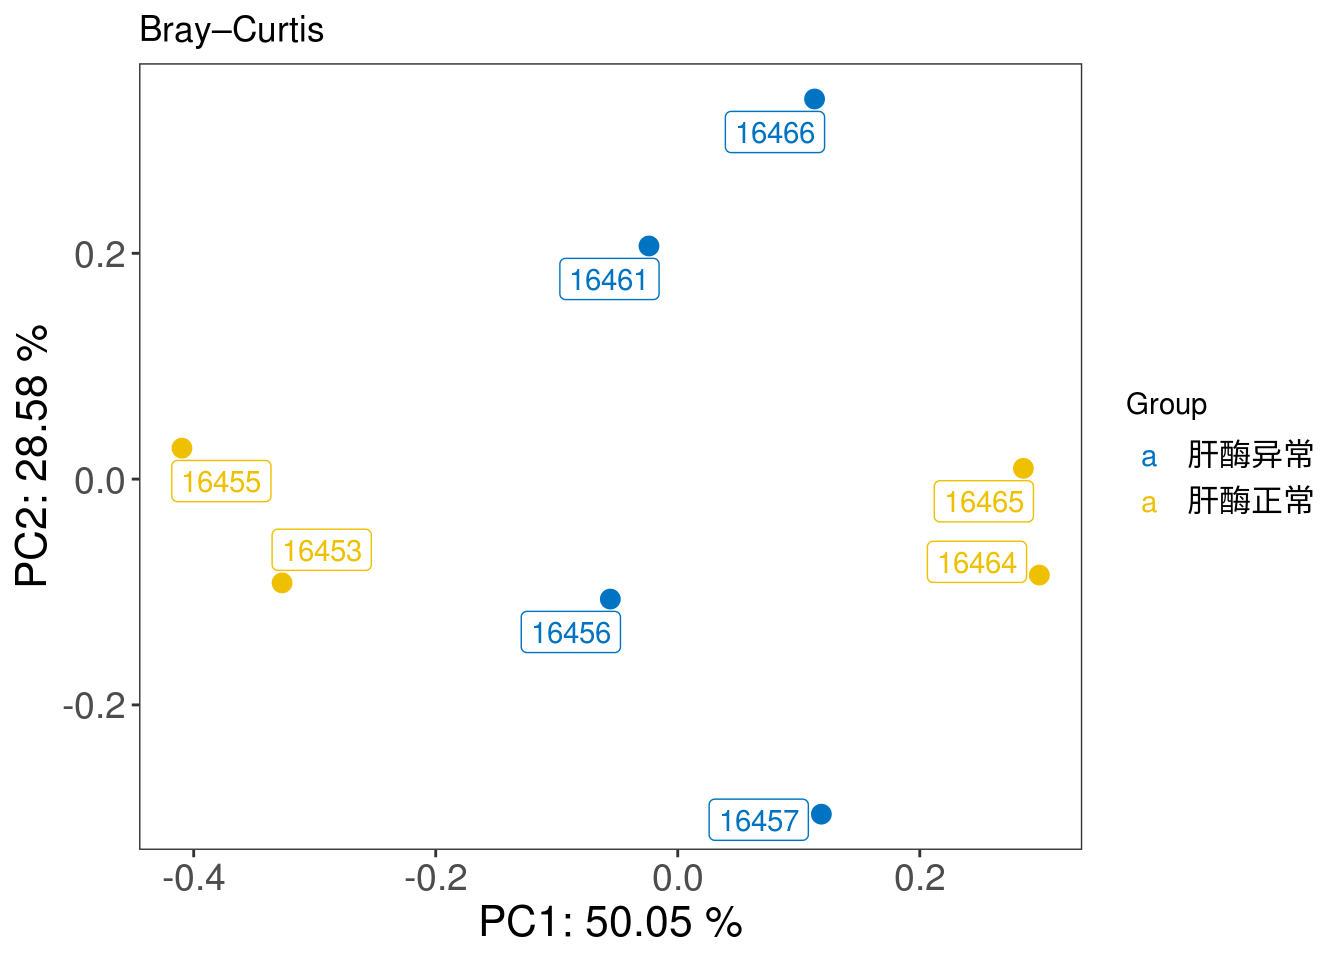
4.5.2 Beta diversity
## In this chunk, we inherit the concept of Beta diversity of microbial taxa data and apply it to pathway data to explore the similarity between samples.

## construct phyloseq for beta diversity analysis

tmp_phyloseq <- phyloseq(otu_table(Filtered_card_profile, taxa_are_rows = TRUE),
                         sample_data(metadata))


## PCoA plot
PCOA_plot <- xviz::plot_beta_diversity(phyloseq = tmp_phyloseq,
                                       feature = 'Group',
                                       method = 'bray',
                                       label = TRUE)
print(PCOA_plot)
## PERMANOVA test & beta dispersion test
## We use PERMANOVA test to check the differences of function composition among different groups. Additionally, we also take homogeneity of group variance into consideration.

dispersion_permanova_res <- run_permanova_betadisp(physeq = tmp_phyloseq,
                                                   vars = 'Group'
                                                   )

dispersion_permanova_res
## $betadisp_res
## variable p_value analysis
## 1 Group 0.273 beta_dispersion_permutation999
##
## $permanova_res
## variable p_value R2 analysis
## 1 Group 0.476 0.1373393 permanova_permutation9994.6 Differential analysis (DA)
4.6.1 Filter low prevalence pathway (DA)
Low prevalence pathways are pathways only occur in minor samples. In this chunk, we would remove pathways apperaing in less than max(2 , 5% of samples) from data set before doing analysis. Remember to run Data preprocessing before running this chunk!
## [1] "907 entries before filtering low prevalence data"Filtered_card_profile <- filter_prevalence(otu_table = Filtered_card_profile,
threshold = 0.05,
taxa_are_rows = TRUE
)
head(Filtered_card_profile, n =2)## 16453 16455 16456 16457 16461 16464 16465 16466
## gb|AAA20116.1|ARO:3000180|tetA(P)_[Clostridium_perfringens] 2.266749e-06 1.249741e-06 9.247141e-07 1.21539e-07 4.040324e-07 0.000000e+00 6.341580e-08 3.858159e-06
## gb|AAA20117.1|ARO:3000195|tetB(P)_[Clostridium_perfringens] 4.260839e-06 3.980291e-06 1.026959e-06 0.00000e+00 4.795510e-07 1.736386e-07 4.890361e-07 9.308673e-06## [1] "725 entries After filtering low prevalence data"4.6.2 DA with LM
Note: Please Filter low prevalence pathway before DA.
## In this chunk, you would be using logistic regression model to find pathways that are significantly enriched in certain group.

## Due to the nature of compositional data, we cannot apply linear models to compositional data directly.
## Transformation of relative abundance data should be carried out before feeding the data to LM.
## Here, we add a very small value (1e-12) to the pathway profile table to avoid genrating NA during transformation, then use logit transformation to transform data. And eventually we apply LM to the transformed data

## Adding small value to the profile table (The value is arbitrary).

DA_card_profile <- Filtered_card_profile + 1e-12

## Reshape profile data table and use logit transformation.

DA_card_profile <- DA_card_profile %>% t() %>% as.data.frame() %>% rownames_to_column('SeqID') %>% as.data.frame()
DA_metadata <- metadata %>% rownames_to_column('SeqID') %>% as.data.frame()

## Reshape dataframe into long table
DA_input <- merge(DA_card_profile, DA_metadata, by='SeqID') %>% reshape2::melt(value.name = 'RA',
                                                                                         variable.name = 'PathwayIDs')

## Logit transformation
DA_input %<>% mutate(RA_logit = log(RA/(1-RA)))

## Fit data to LM
## Loop over each pathway in two groups
LM_res <- DA_input %>%  split(.$PathwayIDs) %>% lapply(., function(x){
  gml_res_summary <- lm(data = x, formula = RA_logit ~ Group) %>% summary() %>% .$coefficients %>% as.matrix() %>% as.data.frame() %>% rownames_to_column(var = "Factors")
  }
)

## Merge all result in one table
LM_res <- LM_res %>% data.table::rbindlist(idcol = "PathwayID") %>% filter(Factors != "(Intercept)")

## Adjust p value using p.adjust function from stats package, you could choose different adjust method.
LM_res %<>% mutate(adjust.p  = stats::p.adjust(.$`Pr(>|t|)`,
                                               method = 'BH'))

## Calculate effect size (Odds ratio) of each feature
LM_res %<>% mutate(OR = exp(Estimate)) %>% as.data.frame()

head(LM_res)
## PathwayID Factors Estimate Std. Error t value Pr(>|t|) adjust.p
## 1 gb|AAA20116.1|ARO:3000180|tetA(P)_[Clostridium_perfringens] Group肝酶正常 -3.44760133 3.4786887 -0.99106347 0.35992376 0.9993136
## 2 gb|AAA20117.1|ARO:3000195|tetB(P)_[Clostridium_perfringens] Group肝酶正常 3.16439828 3.7211162 0.85038953 0.42773400 0.9993136
## 3 gb|AAA23018.1|ARO:3004454|Campylobacter_coli_chloramphenicol_acetyltransferase_[Campylobacter_coli] Group肝酶正常 9.72826026 3.0303720 3.21025277 0.01836118 0.5283449
## 4 gb|AAA23033.2|ARO:3000190|tetO_[Campylobacter_jejuni] Group肝酶正常 -0.02887667 0.3625844 -0.07964124 0.93911245 0.9993136
## 5 gb|AAA25053.1|ARO:3000884|TEM-12_[Klebsiella_oxytoca] Group肝酶正常 0.41660909 3.5283271 0.11807553 0.90986150 0.9993136
## 6 gb|AAA25293.1|ARO:3000192|tetS_[Listeria_monocytogenes] Group肝酶正常 -0.39339749 0.2546723 -1.54472018 0.17336596 0.7089938
## OR
## 1 3.182188e-02
## 2 2.367449e+01
## 3 1.678532e+04
## 4 9.715363e-01
## 5 1.516809e+00
## 6 6.747605e-014.6.3 Show DA result with volcano plot
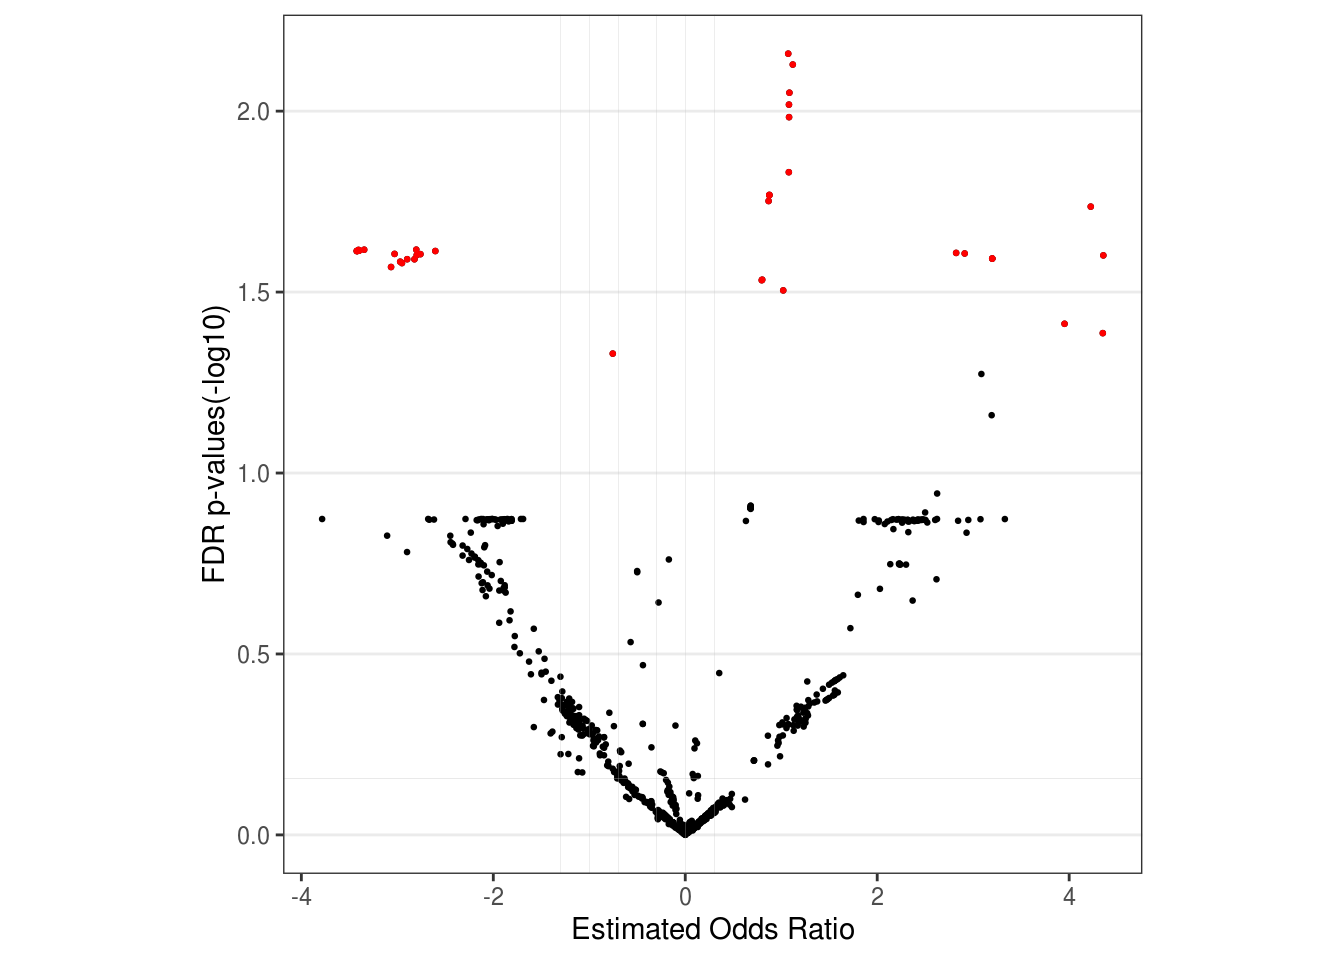
## Plot volcano plot to show effect size (x-axis) and p value (y-axis) of pathways.
## Here we only tend to hightlight pathways that satisfy adjust.p < 0.05 and (OR < 0.2 | OR > 0.5) at the same time.
## You can nevertheless choose different threshold accroding to your own data.

volcano_plot <- LM_res %>% mutate(p.log = -log10(`Pr(>|t|)`), log10OR = log10(OR)) %>%
    ggplot(aes(x = log10OR, y = p.log)) +
    geom_point(size = 0.5) +
    geom_point(size = 0.5, color = "red", data = . %>% filter(`Pr(>|t|)` < 0.05 & (OR < 0.2 | OR > 0.5))) +
    theme_bw() +
    geom_vline(xintercept = log10(c(0.05, 0.1, 0.2, 0.5, 1, 2)), size = 0.05, color = "grey") +
    geom_hline(yintercept = -log10(c(0.7)), size = 0.05, color = "grey") +
    theme(aspect.ratio = 1,
          panel.grid.minor = element_blank(),
          panel.grid.major.x = element_blank()
          ) +
    labs(x = "Estimated Odds Ratio", y = "FDR p-values(-log10)")

print(volcano_plot)
4.7 Session info
## ─ Session info ──────────────────────────────────────────────────────────────────────────────────────────────────────────────────────────────────────────────────────────────
## setting value
## version R version 3.6.3 (2020-02-29)
## os Ubuntu 16.04.7 LTS
## system x86_64, linux-gnu
## ui RStudio
## language (EN)
## collate en_IN.UTF-8
## ctype en_IN.UTF-8
## tz Asia/Hong_Kong
## date 2022-11-09
## rstudio 1.1.419 (server)
## pandoc 2.7.3 @ /usr/bin/ (via rmarkdown)
##
## ─ Packages ──────────────────────────────────────────────────────────────────────────────────────────────────────────────────────────────────────────────────────────────────
## ! package * version date (UTC) lib source
## abind 1.4-5 2016-07-21 [1] CRAN (R 3.6.3)
## ade4 1.7-17 2021-06-17 [1] CRAN (R 3.6.3)
## ALDEx2 * 1.18.0 2019-10-29 [1] Bioconductor
## annotate 1.64.0 2019-10-29 [1] Bioconductor
## AnnotationDbi * 1.58.0 2022-04-26 [1] Bioconductor
## ape 5.5 2021-04-25 [1] CRAN (R 3.6.3)
## assertthat 0.2.1 2019-03-21 [2] CRAN (R 3.6.3)
## backports 1.4.1 2021-12-13 [1] CRAN (R 3.6.3)
## base64enc 0.1-3 2015-07-28 [2] CRAN (R 3.6.3)
## bayesm 3.1-4 2019-10-15 [1] CRAN (R 3.6.3)
## biglm 0.9-2.1 2020-11-27 [1] CRAN (R 3.6.3)
## Biobase * 2.46.0 2019-10-29 [2] Bioconductor
## BiocGenerics * 0.32.0 2019-10-29 [2] Bioconductor
## BiocParallel * 1.20.1 2019-12-21 [2] Bioconductor
## biomformat 1.14.0 2019-10-29 [1] Bioconductor
## Biostrings 2.54.0 2019-10-29 [1] Bioconductor
## bit 4.0.4 2020-08-04 [1] CRAN (R 3.6.3)
## bit64 4.0.5 2020-08-30 [1] CRAN (R 3.6.3)
## bitops 1.0-7 2021-04-24 [1] CRAN (R 3.6.3)
## blob 1.2.2 2021-07-23 [1] CRAN (R 3.6.3)
## bookdown 0.24 2021-09-02 [1] CRAN (R 3.6.3)
## brio 1.1.3 2021-11-30 [2] CRAN (R 3.6.3)
## broom 0.7.12 2022-01-28 [1] CRAN (R 3.6.3)
## bslib 0.3.1 2021-10-06 [1] CRAN (R 3.6.3)
## cachem 1.0.5 2021-05-15 [1] CRAN (R 3.6.3)
## callr 3.7.0 2021-04-20 [2] CRAN (R 3.6.3)
## car 3.0-12 2021-11-06 [1] CRAN (R 3.6.3)
## carData 3.0-4 2020-05-22 [1] CRAN (R 3.6.3)
## caTools 1.18.2 2021-03-28 [1] CRAN (R 3.6.3)
## cellranger 1.1.0 2016-07-27 [1] CRAN (R 3.6.3)
## checkmate 2.0.0 2020-02-06 [1] CRAN (R 3.6.3)
## circlize * 0.4.13 2021-06-09 [1] CRAN (R 3.6.3)
## cli 3.1.0 2021-10-27 [1] CRAN (R 3.6.3)
## clue 0.3-59 2021-04-16 [1] CRAN (R 3.6.3)
## cluster 2.1.0 2019-06-19 [2] CRAN (R 3.6.3)
## coda 0.19-4 2020-09-30 [1] CRAN (R 3.6.3)
## codetools 0.2-16 2018-12-24 [2] CRAN (R 3.6.3)
## coin 1.4-2 2021-10-08 [1] CRAN (R 3.6.3)
## colorspace 2.0-2 2021-06-24 [1] CRAN (R 3.6.3)
## ComplexHeatmap * 2.2.0 2019-10-29 [1] Bioconductor
## compositions 2.0-2 2021-07-14 [1] CRAN (R 3.6.3)
## cowplot * 1.1.1 2020-12-30 [1] CRAN (R 3.6.3)
## crayon 1.5.0 2022-02-14 [1] CRAN (R 3.6.3)
## curl 4.3.2 2021-06-23 [2] CRAN (R 3.6.3)
## dada2 * 1.14.1 2020-02-22 [1] Bioconductor
## data.table * 1.14.0 2021-02-21 [1] CRAN (R 3.6.3)
## DBI 1.1.1 2021-01-15 [1] CRAN (R 3.6.3)
## dbplyr 2.1.1 2021-04-06 [1] CRAN (R 3.6.3)
## DelayedArray * 0.12.3 2020-04-09 [2] Bioconductor
## DelayedMatrixStats 1.8.0 2019-10-29 [1] Bioconductor
## DEoptimR 1.0-9 2021-05-24 [1] CRAN (R 3.6.3)
## desc 1.4.1 2022-03-06 [2] CRAN (R 3.6.3)
## DESeq2 * 1.26.0 2019-10-29 [1] Bioconductor
## devtools 2.4.3 2021-11-30 [1] CRAN (R 3.6.3)
## digest 0.6.29 2021-12-01 [1] CRAN (R 3.6.3)
## dplyr * 1.0.6 2021-05-05 [1] CRAN (R 3.6.3)
## edgeR 3.28.1 2020-02-26 [1] Bioconductor
## ellipsis 0.3.2 2021-04-29 [1] CRAN (R 3.6.3)
## EnhancedVolcano * 1.4.0 2019-10-29 [1] Bioconductor
## enrichR * 3.0 2021-02-02 [1] CRAN (R 3.6.3)
## evaluate 0.15 2022-02-18 [2] CRAN (R 3.6.3)
## fansi 1.0.2 2022-01-14 [1] CRAN (R 3.6.3)
## farver 2.1.0 2021-02-28 [2] CRAN (R 3.6.3)
## fastmap 1.1.0 2021-01-25 [1] CRAN (R 3.6.3)
## fdrtool 1.2.17 2021-11-13 [1] CRAN (R 3.6.3)
## forcats * 0.5.1 2021-01-27 [1] CRAN (R 3.6.3)
## foreach 1.5.2 2022-02-02 [2] CRAN (R 3.6.3)
## foreign 0.8-75 2020-01-20 [2] CRAN (R 3.6.3)
## formatR 1.12 2022-03-31 [2] CRAN (R 3.6.3)
## Formula 1.2-4 2020-10-16 [1] CRAN (R 3.6.3)
## fs 1.5.2 2021-12-08 [1] CRAN (R 3.6.3)
## futile.logger 1.4.3 2016-07-10 [2] CRAN (R 3.6.3)
## futile.options 1.0.1 2018-04-20 [2] CRAN (R 3.6.3)
## genefilter 1.68.0 2019-10-29 [1] Bioconductor
## geneplotter 1.64.0 2019-10-29 [1] Bioconductor
## generics 0.1.2 2022-01-31 [1] CRAN (R 3.6.3)
## GenomeInfoDb * 1.22.1 2020-03-27 [2] Bioconductor
## GenomeInfoDbData 1.2.2 2020-08-24 [2] Bioconductor
## GenomicAlignments 1.22.1 2019-11-12 [1] Bioconductor
## GenomicRanges * 1.38.0 2019-10-29 [2] Bioconductor
## getopt 1.20.3 2019-03-22 [1] CRAN (R 3.6.3)
## GetoptLong 1.0.5 2020-12-15 [1] CRAN (R 3.6.3)
## GGally * 2.1.2 2021-06-21 [1] CRAN (R 3.6.3)
## ggbipart * 0.1.2 2022-07-20 [1] Github (pedroj/bipartite_plots@162f577)
## ggExtra * 0.9 2019-08-27 [1] CRAN (R 3.6.3)
## ggplot2 * 3.3.5 2021-06-25 [1] CRAN (R 3.6.3)
## ggpubr * 0.4.0 2020-06-27 [1] CRAN (R 3.6.3)
## ggrepel * 0.9.1 2021-01-15 [2] CRAN (R 3.6.3)
## ggsci * 2.9 2018-05-14 [1] CRAN (R 3.6.3)
## ggsignif 0.6.3 2021-09-09 [1] CRAN (R 3.6.3)
## glmnet 4.1-2 2021-06-24 [1] CRAN (R 3.6.3)
## GlobalOptions 0.1.2 2020-06-10 [1] CRAN (R 3.6.3)
## glue 1.6.1 2022-01-22 [1] CRAN (R 3.6.3)
## GMPR 0.1.3 2021-05-17 [1] local
## gplots 3.1.1 2020-11-28 [1] CRAN (R 3.6.3)
## graph 1.64.0 2019-10-29 [1] Bioconductor
## gridExtra 2.3 2017-09-09 [2] CRAN (R 3.6.3)
## gtable 0.3.0 2019-03-25 [2] CRAN (R 3.6.3)
## gtools 3.9.2 2021-06-06 [1] CRAN (R 3.6.3)
## haven 2.4.1 2021-04-23 [1] CRAN (R 3.6.3)
## highr 0.9 2021-04-16 [1] CRAN (R 3.6.3)
## Hmisc 4.5-0 2021-02-28 [1] CRAN (R 3.6.3)
## hms 1.1.1 2021-09-26 [1] CRAN (R 3.6.3)
## htmlTable 2.3.0 2021-10-12 [1] CRAN (R 3.6.3)
## htmltools 0.5.2 2021-08-25 [1] CRAN (R 3.6.3)
## htmlwidgets 1.5.4 2021-09-08 [2] CRAN (R 3.6.3)
## httpuv 1.6.1 2021-05-07 [1] CRAN (R 3.6.3)
## httr 1.4.3 2022-05-04 [2] CRAN (R 3.6.3)
## hwriter 1.3.2 2014-09-10 [1] CRAN (R 3.6.3)
## igraph 1.3.1 2022-04-20 [2] CRAN (R 3.6.3)
## IHW 1.14.0 2019-10-29 [1] Bioconductor
## IRanges * 2.20.2 2020-01-13 [2] Bioconductor
## iterators 1.0.14 2022-02-05 [2] CRAN (R 3.6.3)
## jpeg 0.1-9 2021-07-24 [1] CRAN (R 3.6.3)
## jquerylib 0.1.4 2021-04-26 [1] CRAN (R 3.6.3)
## jsonlite 1.8.0 2022-02-22 [2] CRAN (R 3.6.3)
## KEGGgraph 1.46.0 2019-10-29 [1] Bioconductor
## KEGGREST 1.26.1 2019-11-06 [1] Bioconductor
## KernSmooth 2.23-16 2019-10-15 [2] CRAN (R 3.6.3)
## knitr 1.36 2021-09-29 [1] CRAN (R 3.6.3)
## labeling 0.4.2 2020-10-20 [2] CRAN (R 3.6.3)
## lambda.r 1.2.4 2019-09-18 [2] CRAN (R 3.6.3)
## later 1.3.0 2021-08-18 [2] CRAN (R 3.6.3)
## lattice * 0.20-38 2018-11-04 [2] CRAN (R 3.6.3)
## latticeExtra 0.6-29 2019-12-19 [1] CRAN (R 3.6.3)
## lazyeval 0.2.2 2019-03-15 [2] CRAN (R 3.6.3)
## libcoin 1.0-9 2021-09-27 [1] CRAN (R 3.6.3)
## lifecycle 1.0.1 2021-09-24 [1] CRAN (R 3.6.3)
## limma 3.42.2 2020-02-03 [2] Bioconductor
## locfit 1.5-9.4 2020-03-25 [1] CRAN (R 3.6.3)
## lpsymphony 1.14.0 2019-10-29 [1] Bioconductor (R 3.6.3)
## lubridate 1.7.10 2021-02-26 [1] CRAN (R 3.6.3)
## Maaslin2 1.7.3 2022-03-23 [1] Github (biobakery/maaslin2@8d090e4)
## magrittr * 2.0.2 2022-01-26 [1] CRAN (R 3.6.3)
## MASS 7.3-54 2021-05-03 [1] CRAN (R 3.6.3)
## Matrix 1.3-4 2021-06-01 [1] CRAN (R 3.6.3)
## matrixStats * 0.60.0 2021-07-26 [1] CRAN (R 3.6.3)
## mbzinb 0.2 2021-06-23 [1] local
## memoise 2.0.1 2021-11-26 [2] CRAN (R 3.6.3)
## metagenomeSeq 1.28.2 2020-02-03 [1] Bioconductor
## metamicrobiomeR 1.1 2021-02-03 [1] local
## mgcv 1.8-31 2019-11-09 [2] CRAN (R 3.6.3)
## microbiome 1.8.0 2019-10-29 [1] Bioconductor
## mime 0.12 2021-09-28 [2] CRAN (R 3.6.3)
## miniUI 0.1.1.1 2018-05-18 [1] CRAN (R 3.6.3)
## modelr 0.1.8 2020-05-19 [1] CRAN (R 3.6.3)
## modeltools 0.2-23 2020-03-05 [1] CRAN (R 3.6.3)
## multcomp 1.4-17 2021-04-29 [1] CRAN (R 3.6.3)
## multtest 2.42.0 2019-10-29 [2] Bioconductor
## munsell 0.5.0 2018-06-12 [2] CRAN (R 3.6.3)
## mvtnorm 1.1-3 2021-10-08 [1] CRAN (R 3.6.3)
## network * 1.17.1 2021-06-14 [1] CRAN (R 3.6.3)
## nlme 3.1-144 2020-02-06 [2] CRAN (R 3.6.3)
## nnet 7.3-12 2016-02-02 [2] CRAN (R 3.6.3)
## optparse 1.7.1 2021-10-08 [1] CRAN (R 3.6.3)
## org.Hs.eg.db * 3.10.0 2021-12-08 [1] Bioconductor
## pathview * 1.26.0 2019-10-29 [1] Bioconductor
## pcaPP 1.9-74 2021-04-23 [1] CRAN (R 3.6.3)
## permute * 0.9-5 2019-03-12 [1] CRAN (R 3.6.3)
## phyloseq * 1.30.0 2019-10-29 [1] Bioconductor
## pillar 1.7.0 2022-02-01 [1] CRAN (R 3.6.3)
## pkgbuild 1.3.1 2021-12-20 [2] CRAN (R 3.6.3)
## pkgconfig 2.0.3 2019-09-22 [2] CRAN (R 3.6.3)
## pkgload 1.2.4 2021-11-30 [2] CRAN (R 3.6.3)
## plotly * 4.10.0 2021-10-09 [1] CRAN (R 3.6.3)
## plyr 1.8.7 2022-03-24 [2] CRAN (R 3.6.3)
## png 0.1-7 2013-12-03 [1] CRAN (R 3.6.3)
## prettyunits 1.1.1 2020-01-24 [2] CRAN (R 3.6.3)
## processx 3.5.3 2022-03-25 [2] CRAN (R 3.6.3)
## promises 1.2.0.1 2021-02-11 [2] CRAN (R 3.6.3)
## protoclust 1.6.3 2019-01-31 [1] CRAN (R 3.6.3)
## ps 1.7.0 2022-04-23 [2] CRAN (R 3.6.3)
## pscl 1.5.5 2020-03-07 [1] CRAN (R 3.6.3)
## purrr * 0.3.4 2020-04-17 [2] CRAN (R 3.6.3)
## qvalue 2.18.0 2019-10-29 [1] Bioconductor
## R6 2.5.1 2021-08-19 [1] CRAN (R 3.6.3)
## RAIDA 1.0 2021-06-23 [1] local
## ranacapa 0.1.0 2021-06-18 [1] Github (gauravsk/ranacapa@58c0cab)
## RColorBrewer * 1.1-3 2022-04-03 [2] CRAN (R 3.6.3)
## Rcpp * 1.0.7 2021-07-07 [1] CRAN (R 3.6.3)
## RcppParallel 5.1.4 2021-05-04 [1] CRAN (R 3.6.3)
## RCurl 1.98-1.6 2022-02-08 [2] CRAN (R 3.6.3)
## readr * 2.0.0 2021-07-20 [1] CRAN (R 3.6.3)
## readxl * 1.3.1 2019-03-13 [1] CRAN (R 3.6.3)
## remotes 2.4.2 2021-11-30 [1] CRAN (R 3.6.3)
## reprex 2.0.1 2021-08-05 [1] CRAN (R 3.6.3)
## reshape 0.8.9 2022-04-12 [1] CRAN (R 3.6.3)
## reshape2 * 1.4.4 2020-04-09 [2] CRAN (R 3.6.3)
## Rgraphviz 2.30.0 2019-10-29 [1] Bioconductor
## rhdf5 2.30.1 2019-11-26 [1] Bioconductor
## Rhdf5lib 1.8.0 2019-10-29 [1] Bioconductor
## rJava 1.0-5 2021-09-24 [1] CRAN (R 3.6.3)
## rjson 0.2.20 2018-06-08 [1] CRAN (R 3.6.3)
## R rlang 1.0.2 <NA> [2] <NA>
## rmarkdown 2.11 2021-09-14 [1] CRAN (R 3.6.3)
## robustbase 0.93-9 2021-09-27 [1] CRAN (R 3.6.3)
## rpart 4.1-15 2019-04-12 [2] CRAN (R 3.6.3)
## rprojroot 2.0.2 2020-11-15 [1] CRAN (R 3.6.3)
## Rsamtools 2.2.3 2020-02-23 [1] Bioconductor
## RSQLite 2.2.7 2021-04-22 [1] CRAN (R 3.6.3)
## rstatix 0.7.0 2021-02-13 [1] CRAN (R 3.6.3)
## rstudioapi 0.13 2020-11-12 [2] CRAN (R 3.6.3)
## Rtsne 0.15 2018-11-10 [1] CRAN (R 3.6.3)
## rvest 1.0.2 2021-10-16 [1] CRAN (R 3.6.3)
## S4Vectors * 0.24.4 2020-04-09 [2] Bioconductor
## sandwich 3.0-1 2021-05-18 [1] CRAN (R 3.6.3)
## sass 0.4.0 2021-05-12 [1] CRAN (R 3.6.3)
## scales 1.2.0 2022-04-13 [2] CRAN (R 3.6.3)
## seqinr * 4.2-8 2021-06-09 [1] CRAN (R 3.6.3)
## sessioninfo 1.2.2 2021-12-06 [2] CRAN (R 3.6.3)
## shape 1.4.6 2021-05-19 [1] CRAN (R 3.6.3)
## shiny 1.7.1 2021-10-02 [1] CRAN (R 3.6.3)
## ShortRead 1.44.3 2020-02-03 [1] Bioconductor
## slam 0.1-49 2021-11-17 [1] CRAN (R 3.6.3)
## statnet.common 4.5.0 2021-06-05 [1] CRAN (R 3.6.3)
## stringi 1.7.4 2021-08-25 [1] CRAN (R 3.6.3)
## stringr * 1.4.0 2019-02-10 [2] CRAN (R 3.6.3)
## SummarizedExperiment * 1.16.1 2019-12-19 [2] Bioconductor
## survival 3.1-8 2019-12-03 [2] CRAN (R 3.6.3)
## tensorA 0.36.2 2020-11-19 [1] CRAN (R 3.6.3)
## testthat 3.1.4 2022-04-26 [2] CRAN (R 3.6.3)
## textshape 1.7.3 2021-05-28 [1] CRAN (R 3.6.3)
## TH.data 1.1-0 2021-09-27 [1] CRAN (R 3.6.3)
## tibble * 3.1.6 2021-11-07 [1] CRAN (R 3.6.3)
## tidyr * 1.2.0 2022-02-01 [1] CRAN (R 3.6.3)
## tidyselect 1.1.1 2021-04-30 [1] CRAN (R 3.6.3)
## tidyverse * 1.3.1 2021-04-15 [1] CRAN (R 3.6.3)
## tzdb 0.2.0 2021-10-27 [1] CRAN (R 3.6.3)
## UpSetR 1.4.0 2019-05-22 [1] CRAN (R 3.6.3)
## usethis 2.1.6 2022-05-25 [2] CRAN (R 3.6.3)
## utf8 1.2.2 2021-07-24 [1] CRAN (R 3.6.3)
## vctrs 0.3.8 2021-04-29 [1] CRAN (R 3.6.3)
## vegan * 2.5-7 2020-11-28 [1] CRAN (R 3.6.3)
## VennDiagram 1.7.1 2021-12-02 [1] CRAN (R 3.6.3)
## viridisLite 0.4.0 2021-04-13 [2] CRAN (R 3.6.3)
## vroom 1.5.7 2021-11-30 [1] CRAN (R 3.6.3)
## wesanderson * 0.3.6.9000 2021-07-21 [1] Github (karthik/wesanderson@651c944)
## withr 2.4.3 2021-11-30 [1] CRAN (R 3.6.3)
## Wrench 1.4.0 2019-10-29 [1] Bioconductor
## xfun 0.23 2021-05-15 [1] CRAN (R 3.6.3)
## xlsx * 0.6.5 2020-11-10 [1] CRAN (R 3.6.3)
## xlsxjars 0.6.1 2014-08-22 [1] CRAN (R 3.6.3)
## XMAS * 0.0.0.9000 2022-03-23 [1] local
## XMAS2 2.1.8.3 2022-11-08 [2] local
## XML 3.99-0.3 2020-01-20 [1] CRAN (R 3.6.3)
## xml2 1.3.3 2021-11-30 [2] CRAN (R 3.6.3)
## xtable 1.8-4 2019-04-21 [1] CRAN (R 3.6.3)
## XVector 0.26.0 2019-10-29 [2] Bioconductor
## xviz * 1.1.0 2021-01-14 [1] local
## yaml 2.2.2 2022-01-25 [1] CRAN (R 3.6.3)
## zlibbioc 1.32.0 2019-10-29 [2] Bioconductor
## zoo 1.8-9 2021-03-09 [1] CRAN (R 3.6.3)
##
## [1] /share/home/tongbangzhuo/R/x86_64-pc-linux-gnu-library/3.6
## [2] /opt/R-3.6.3/lib/R/library
##
## R ── Package was removed from disk.
##
## ─────────────────────────────────────────────────────────────────────────────────────────────────────────────────────────────────────────────────────────────────────────────